The GREEN-DB
GREEN-DB is a comprehensive collection of potential regulatory regions in the human genome including ~2.4M regions from 16 data sources and covering ~1.5Gb evenly distributed across chromosomes. The regulatory regions are grouped in 5 categories: enhancer, promoter, silencer, bivalent, insulator.
Each region is described by its genomic location, region type, method(s) of detection, data source and closest gene; ~35% of regions are annotated with controlled genes, ~40% with tissue(s) of activity, and ~14% have associated phenotype(s). GREEN-DB is available as an SQLite database and regions information with controlled genes are also provided as extended BED files for easy integration into existing analysis pipelines.
For details on how the database was compiled please refer to the original publication https://doi.org/10.1101/2020.09.17.301960
The GREEN-DB database is available for free for academic use and available for download in a Zenodo repository. The full database is available as SQLite and a summary of region-based information is provided in BED files.
Database region content
GRCh38
GREEN-DB |
N |
Bases covered |
|---|---|---|
N Enhancer |
1832830 |
1449153178 |
N Promoter |
565323 |
234315553 |
N Silencer |
4302 |
894792 |
N Bivalent |
8409 |
11210309 |
N Insulator |
23 |
17504 |
All regions |
2410887 |
1502180018 |
GRCh37
GREEN-DB |
N |
Bases covered |
|---|---|---|
N Enhancer |
1834183 |
1450755698 |
N Promoter |
566102 |
234890654 |
N Silencer |
4306 |
895868 |
N Bivalent |
8413 |
11215000 |
N Insulator |
23 |
17504 |
All regions |
2413027 |
1504116499 |
Summary statistics on the database

Main information in the database
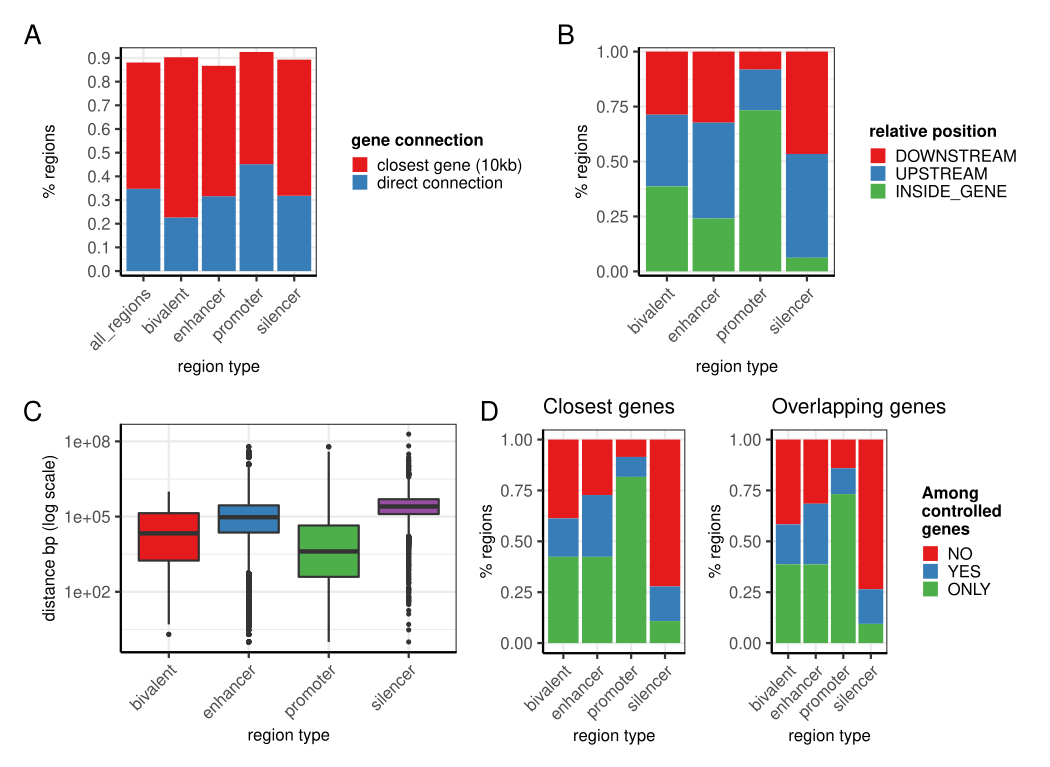
Summary information on gene-region connections
SQLite database structure
The SQLite database contains 16 tables (expected columns are listed in the image):
- GRCh37 / GRCh38 regions
GREEN-DB regions coordinate; region type; constraint percentile; closest gene symbol, Ensembl ID and distance; PhyloP100 statistics
- Tissues
tissue(s) of activity for a region or a region-gene interaction
- Genes
controlled gene(s)
- Methods
method(s) supporting each region and region-gene interaction. This may correspond to the data source when no specific method information was available.
- Phenotypes
potentially associated phenotypes
- GRCh37 / GRCh38 TFBS
transcription factor binding sites
- GRCh37 / GRCh38 DNase
DNase hypersensitivity peaks
- GRCh37 / GRCh38 dbSuper
super-enhancers as defined by dbSuper
- GRCh37 / GRCh38 LoF_tolerance
the probability of LoF tolerance for enhancers
- GRCh37 / GRCh38 UCNE
ultraconserved noncoding elements
- GRCh37 / GRCh38 TAD
TAD domains from TADKB
Main tables (regions, tissues, genes and methods) are linked by the unique region ID. Additionally, a unique interaction ID identifies each gene-region pair in the gene table and it’s linked to methods and tissues tables. Linking tables are included that map the overlap between GREEN-DB region IDs and each of TFBS, DNase, dbSuper and LoF_tolerance region IDs, reporting also the fraction of overlap.

A schematic representation of GREEN-DB.
The constraint metric
For each region we calculated a contraint metric representing the tolerance to genetic variations. Constraint ranges 0-1 with higher values associated to higher level of variation constraint. Regions with high constraint values (especially > 0.9) are more likely to control essential genes and genes involved in human diseases. The constraint value is also higher for genes intolerant to LoF variants according to the gnomAD oe_lof metric

Constraint values for regions associated to essential/pathogenic genes
Summary of the building process
In GREEN-DB we collected and aggregated information from 17 different sources, including
8 previously published curated databases
6 experimental datasets from recently published articles
predicted regulatory regions from 3 different algorithms
Four additional datasets were included to integrate region to gene / phenotype relationships. We also collected additional data useful in evaluating the regulatory role of genomic regions, including - TFBS and DNase peaks - ultraconserved non-coding elements (UCNE) - super-enhancer definitions - enhancer LoF tolerance

Summary of the GREEN-DB building process
Extract database tables
Using bash
You can extract all tables of the database to tab-separated tables using a bash script. In the following example the db file is provided as argument and all tables are saved as .tsv files in the present folder
dbfile=$1

# obtains all data tables from database
TS=`sqlite3 $1 "SELECT tbl_name FROM sqlite_master WHERE type='table' and tbl_name not like 'sqlite_%';"`

# exports each table to tsv
for T in $TS; do
sqlite3 $1 <<!
.headers on
.mode tabs
.output $T.tsv
select * from $T;
!
done
Using R
You can extract tables from the database in R using the RSQLite package. In the example below we extract all tables to data frames in a named list (dbtables)
library("RSQLite")

## connect to the SQLite database
    con <- dbConnect(drv=RSQLite::SQLite(), dbname="SQlite/RegulatoryRegions.db")

## list all data tables
    tables <- dbListTables(con)

## create a data.frame for each table
    for (i in seq(along=tables)) {
            dbtables[[tables[i]]] <- dbGetQuery(conn=con, statement=paste("SELECT * FROM '", tables[[i]], "'", sep=""))
    }